Posts with topic: Debugging+Profiling

gprof, Valgrind and gperftools - an evaluation of some tools for application level CPU profiling on Linux

In this post I give an overview of my evaluation of three different CPU profiling tools: gperftools, Valgrind and gprof. I evaluated the three tools on usage, functionality, accuracy and runtime overhead. The usage of the different profilers is demonstrated with the small demo program cpuload, available via my github repository gklingler/cpuProfilingDemo. The intent of cpuload.cpp is just to generate some CPU load - it does nothing useful. The bash scripts in the same repo (which are also listed below) show how to compile/link the cpuload.
→ Read More
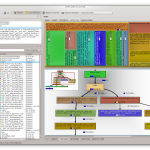
A simple, customized logger, based on Boost.Log v2

Todays applications grow rapidly, complexity increases and finding bugs becomes more and more difficult. Especially for multi threaded applications, for applications that heavily depend on asynchronous external events or for applications that you don’t have local access to, an appropriate logging facility is invaluable for tracking down bugs. Boost.Log (v2) is a powerful C++ library that provides a simple way to integrate an extensible and performant logging facility in your application.
→ Read More